See everything. Control everything. From one rack to one hundred data halls.
CMS — the Centralise Management System — is the unified Data Center Infrastructure Management & Monitoring platform for teams who run their own infrastructure, at any scale. Real-time telemetry, alarms, assets, floor plans, capacity, and reporting in one screen — with an AI assistant that turns plain-English questions into action.
Real-time monitoring AI operations assistant Priced to start small
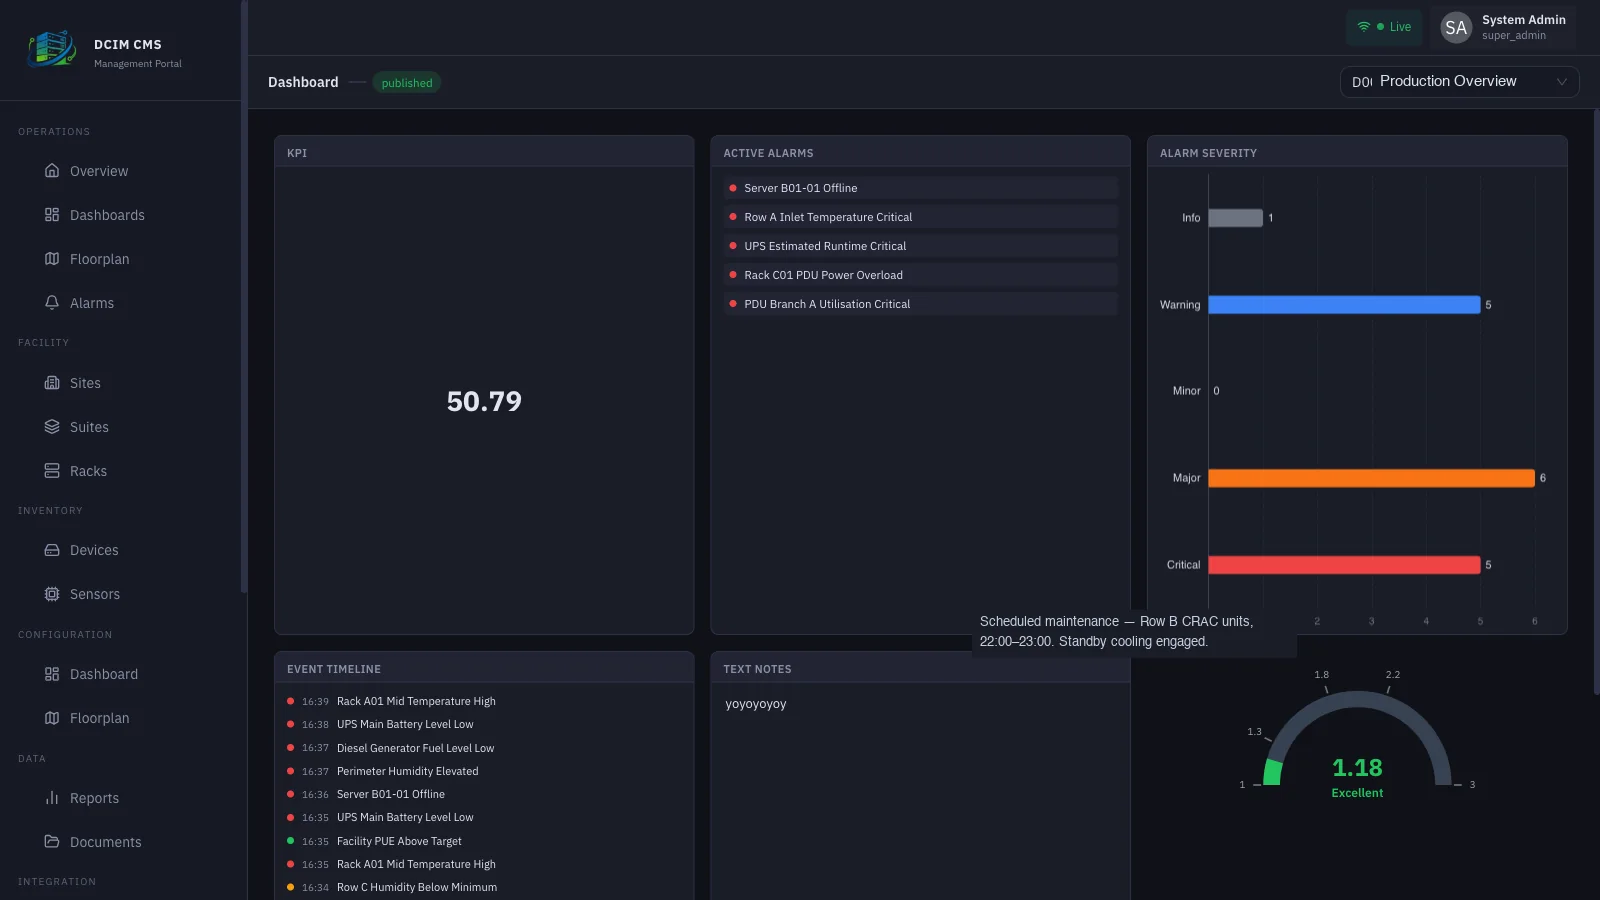
PUE
1.18
Excellent
Load · Hall 2
Active alarms
Why CMS
Stop running your data center from spreadsheets.
“One platform. Real-time visibility. Built to grow with you — and priced to start small.”
Built for both ends
The same product, from one room to a global estate.
| Small scale | Large scale | |
|---|---|---|
| Who it’s for | Edge sites, server rooms, single-site facilities, regional ops | Colocation, enterprise & wholesale data centers, multi-hall / multi-site estates |
| Start with | 1 site · up to 5,000 monitored points · all-in-one install | Multiple sites & suites · tens of thousands of points · high-availability cluster |
| Value | Replace spreadsheets and blind spots with live monitoring in days | Consolidate vendor silos into a single source of truth with full audit & RBAC |
| Grow via | License upgrade — no re-platforming, no data migration | Horizontal scale-out of API / Worker / Scheduler roles + HA failover |
The same product powers both. Start where you are and upgrade capacity and modules through licensing — without redesigning anything you’ve already built.
What you get
A complete DCIM toolkit in one platform.
Real-Time Dashboards
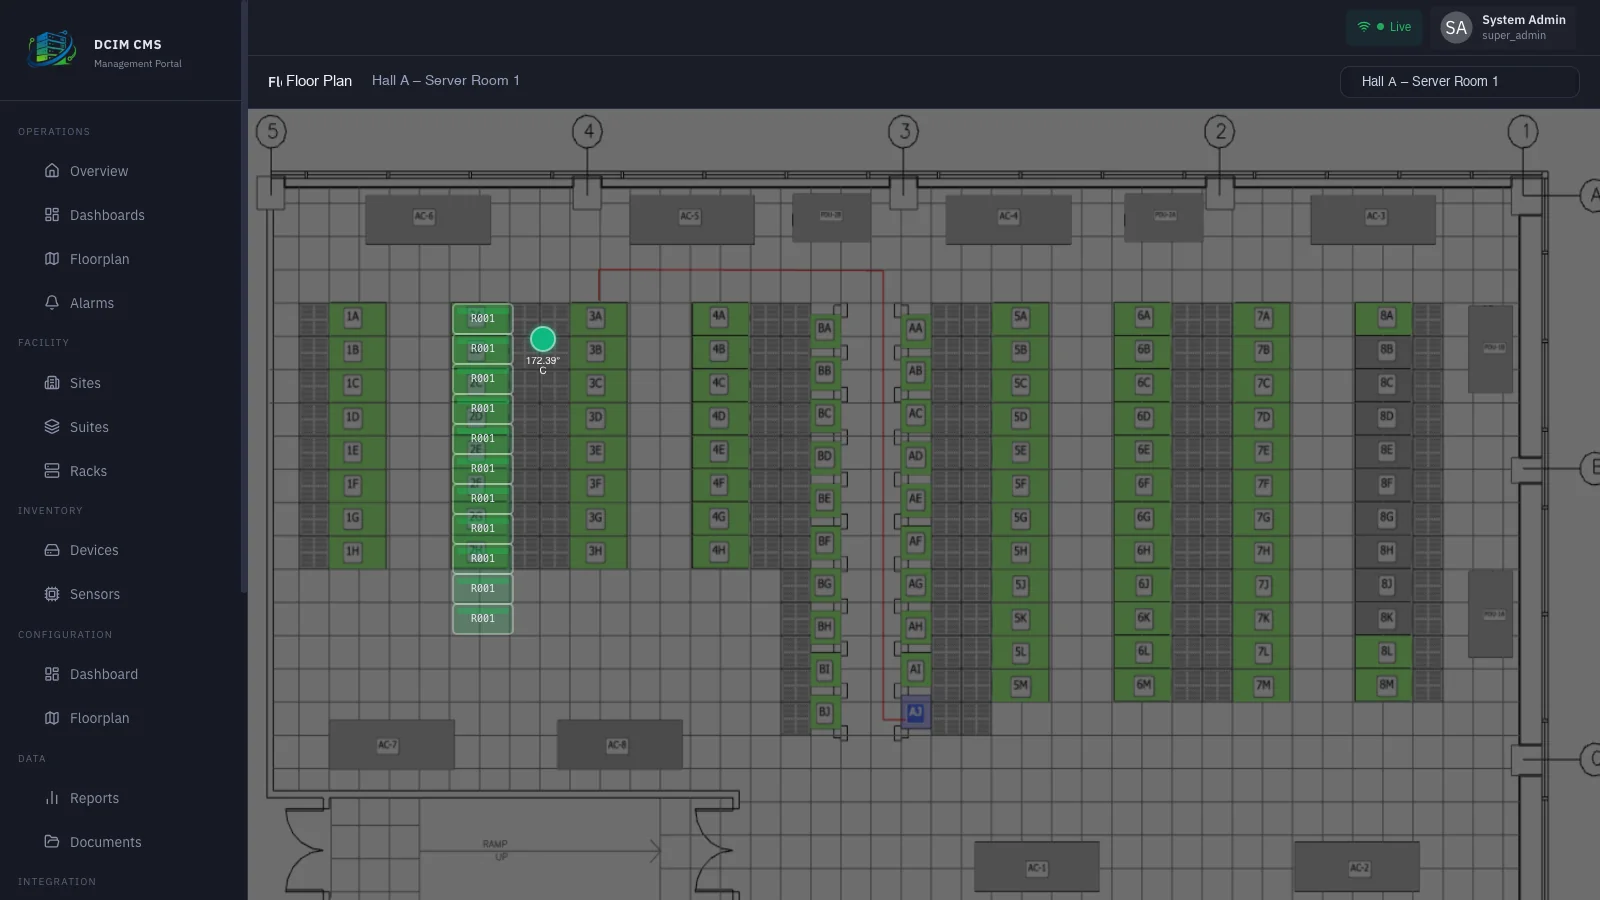
Interactive Floor Plans
Real-Time Alarm & Alert Management
Sensor & Telemetry Monitoring
Asset, Rack, Site & Suite Management
Reporting & Analytics
Security, Multi-Tenancy & Audit
File Management
Five alarm severities
Every alert is classified, tracked through its full lifecycle, and recorded in an immutable history.
Sensor & telemetry
Thousands of points, every domain.
Environmental
Power & Electrical
Cooling & Airflow
Security & Access
IT Equipment
Derived / Virtual
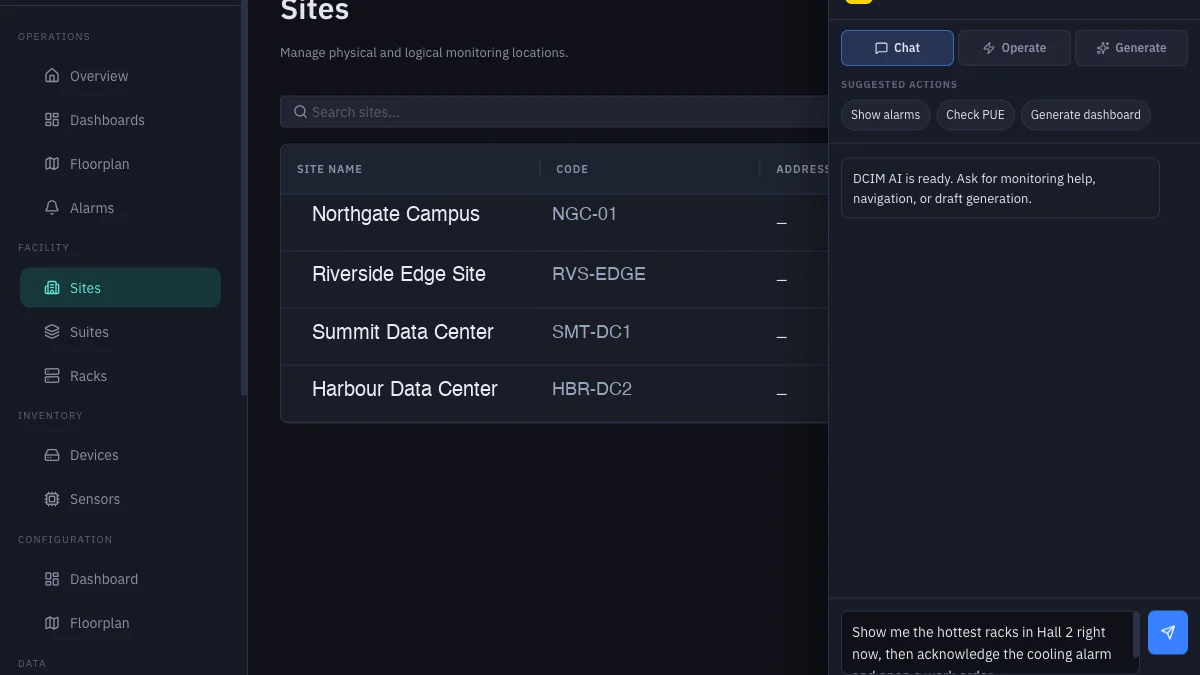
An AI operations assistant that does real work.
Ask and act in plain language. The assistant pulls live status, analyzes temperature anomalies and power spikes, compares trends, acknowledges alarms, assigns technicians, creates work orders, generates reports, and even drafts a dashboard or floor plan. Every action runs through guardrails and is fully audited.
- “Show me the hottest racks in Hall 2 right now.”
- “Analyze the power spike on PDU-14 last night.”
- “Acknowledge the cooling alarm and create a work order for the on-call tech.”
- “Generate this month’s power billing report for Suite A.”
Bring your own model: Anthropic Claude OpenAI Self-hosted Ollama
CMS AI Assistant
Show me the hottest racks in Hall 2 and acknowledge the cooling alarm.
Top 3 racks by inlet temp in Hall 2:
- Rack A0131.4 °C
- Rack A0329.8 °C
- Rack B0728.1 °C
Cooling alarm acknowledged · work order #4821 created
Integrations
Vendor-neutral by design.
Schneider EcoStruxure
MQTT
Webhooks & REST API
ITSM / Ticketing
BMS
Data Export Sinks
Enterprise-grade by design
Architected to scale and stay up.
| Capability | How it works |
|---|---|
| Scales with you | API / Worker / Scheduler roles scale out independently. |
| High availability | Optional master/slave HA with automatic failover. |
| Fast at scale | Time-series DB, Redis caching, and a background job queue. |
| Real-time | Live alarm and status streaming to every console. |
| Flexible storage | Files on S3 or local disk — your choice. |
| Deploy anywhere | Docker / VM / OVA on-prem, private cloud, or edge — one-command all-in-one installer. |
| Open & extensible | Documented REST API + webhook framework, with bring-your-own AI. |
Technology foundation
Licensing
Start small. Upgrade by license.
| Dimension | Starter | Upgrade path |
|---|---|---|
| Tenants | 1 | Multi-tenant |
| Sites | 1 | Many |
| Suites | 5 | Expand |
| Dashboards | 5 | Expand |
| Monitored sensor points | 5,000 | Tens of thousands+ |
| Modules | Core set | Enable add-ons |
Usage-based licensing enforced consistently across UI and API, with live visibility into utilization vs. entitlement.
Why teams choose CMS
Built for operators.
- One pane of glass
- Real-time, not yesterday’s data
- Vendor-neutral
- AI that does real work
- Right-sized economics
- Audit-ready & secure
- Deploy on your terms — you own your data
Get started
Five steps to eyes wide open.
- 01
Assess
We map your sites, sensors, and integration targets to the CMS model.
- 02
Deploy
One-command all-in-one install on-prem, in private cloud, or at the edge.
- 03
Onboard
Import your hierarchy, dashboards, and floor plans — and your team.
- 04
Integrate
Connect EcoStruxure, MQTT, BMS, and ITSM through open APIs and webhooks.
- 05
Operate
Go live with real-time visibility, alarms, and the AI assistant.
See it in action
See CMS in action.
Solutions
Built for every kind of estate.
Colocation & multi-tenant
Enterprise & wholesale
Edge sites & server rooms
Energy & sustainability
Get started
Run your data center with eyes wide open.
Tell us about your sites, sensors, and integration targets — we'll show you CMS live, mapped to your environment, at the scale you run today.